By: Ben Elfner
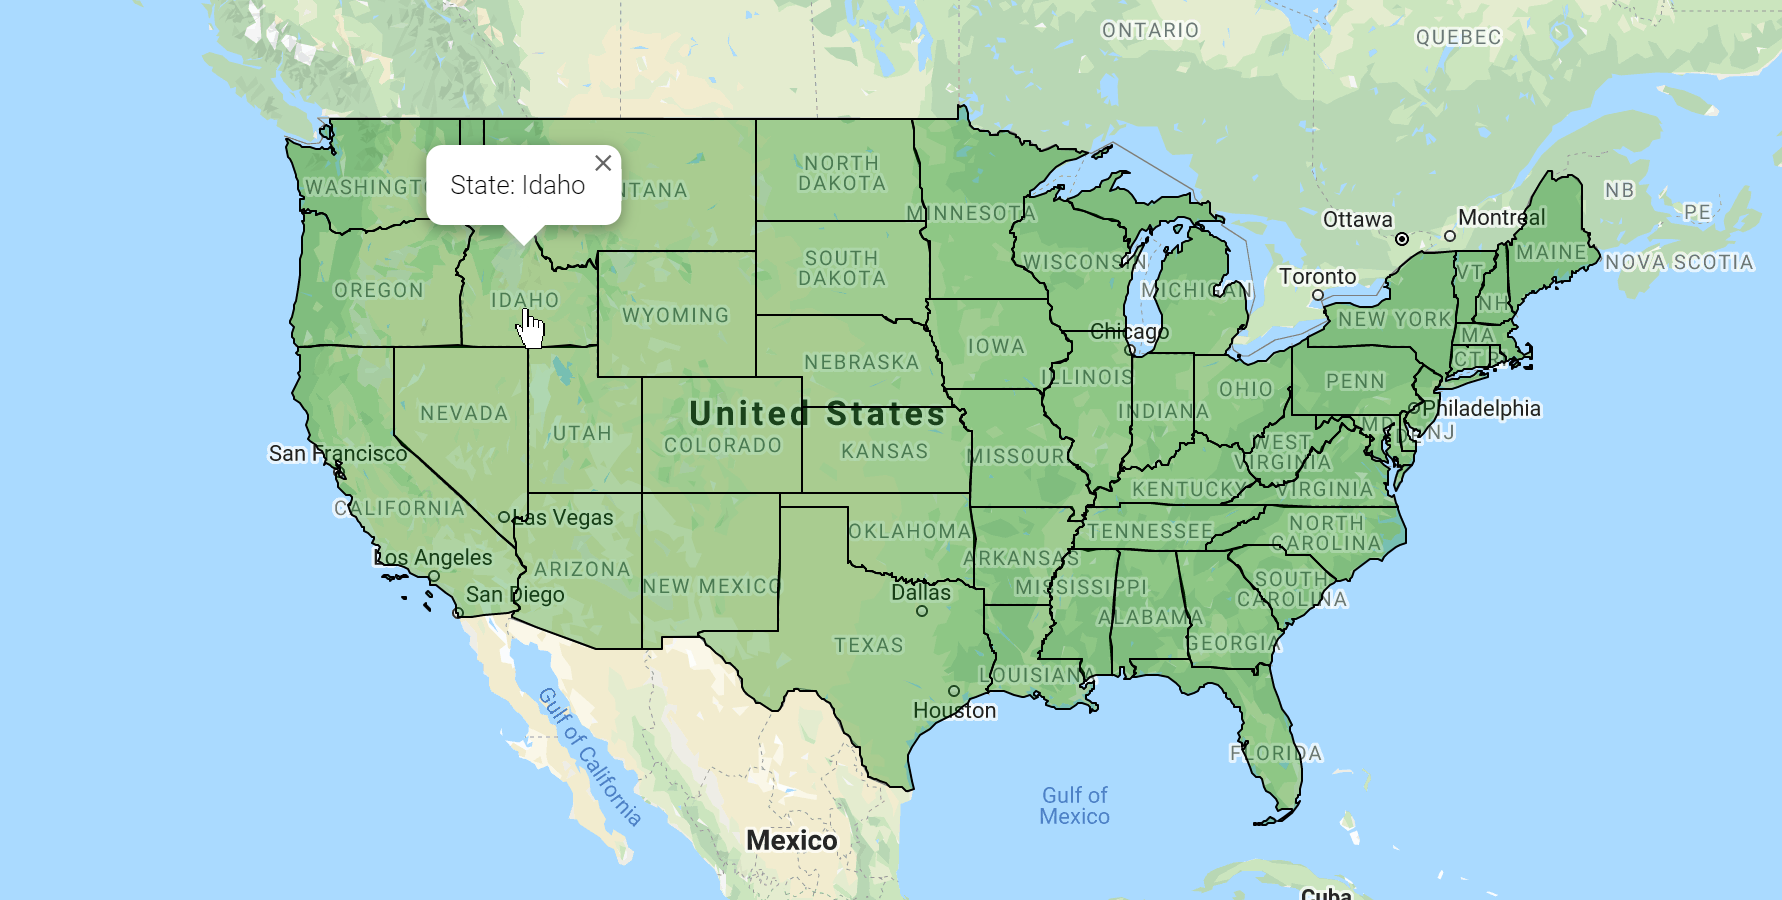
In this tutorial, you'll learn how to overlay polygon shapes onto Google Maps and embed it into a website. As an example, we'll overlay U.S. state shapes onto a map. Data processing will be done with mapshaper.org which you can learn more about in our Guide to MapShaper. When you are done, you'll have a map that looks like this:
Download Demo (.zip) View Demo Online
Before we begin you must get an API key from Google. To do this you must first create a Google Cloud Platform Project, Activate the Maps JavaScript API, and then generate an API key.
Important Note: To follow this tutorial, you must use the Maps JavaScript API not the Maps Embed API.
Add the following CSS to your webpage via a style tag:
<style>
    #map {
        height: 100%;
    }
    /* Optional: Makes the sample page fill the window. */
    html, body {
        height: 100%;
        margin: 0;
        padding: 0;
    }
</style>
Then insert this snippet wherever you want your map to be located:
<div id="map"></div>
Finally, we'll add the JavaScript to initialize the map. Add the following to your webpage. Replace YOUR_KEY_HERE with the key from your project in Step 1.
<script>
    var map;

    function initMap() {
        map = new google.maps.Map(document.getElementById('map'), {
            zoom: 3,
            center: {
                lat: 39.8283,
                lng: -98.5795
            }
        });
    }
</script>
<script async defer src="https://maps.googleapis.com/maps/api/js?key=YOUR_KEY_HERE&callback=initMap" type="text/javascript"></script>
Once you have Google Maps embedded into your website, you can add geographic data to it.
For this tutorial we'll be getting our U.S. state data from the US Census Bureau. A cleaned version that you can use with this tutorial can be downloaded here. The data is in Shapefile format. A Shapefile is actually comprised of 4 different files with the extensions (.shp, .shx, .dbf, .sbn).
You'll need to unzip this folder before moving forward.
To use this data with Google Maps it will need to be converted from the Shapefile format to the GeoJSON format. To do this you will first need to upload it to mapshaper.org. This tool gives us an easy method to convert between different geographic data file formats.
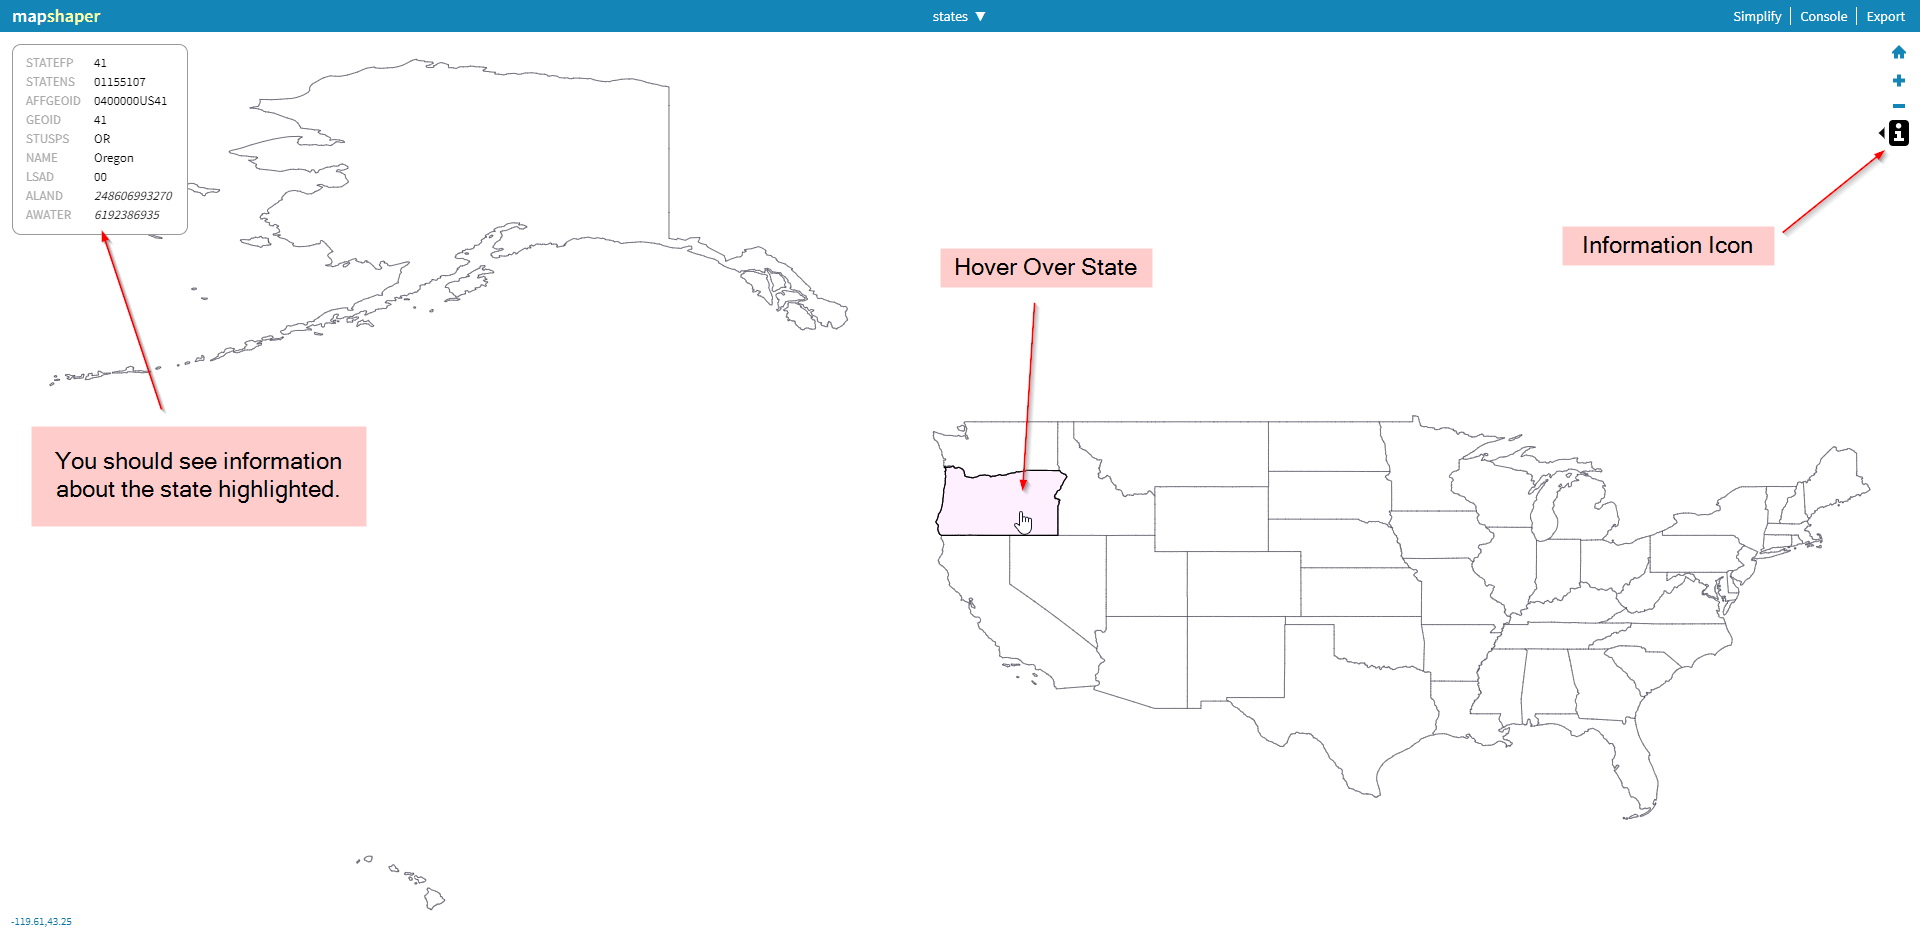
If you want to manipulate the data of the polygons, you can view the "Editing Shapefiles with MapShaper" section on our guide to MapShaper.
Finally, to export the data:
This will download the data in the GeoJSON format.
To add the data to the embedded map:
initMap() and replace PATH with the path to the GeoJSON file on your website:map.data.loadGeoJson('PATH');
a example of this could be:
map.data.loadGeoJson('http://example.com/states.json');
your code should end up like this
    <div id="map">
        <script>
            var map;
            function initMap() {
                map = new google.maps.Map(document.getElementById('map'), {
                    zoom: 3,
                    center: {
                        lat: 39.8283,
                        lng: -98.5795
                    }
                });
    `
                map.data.loadGeoJson('http://example.com/states.json');
            }
        </script>
    </div>
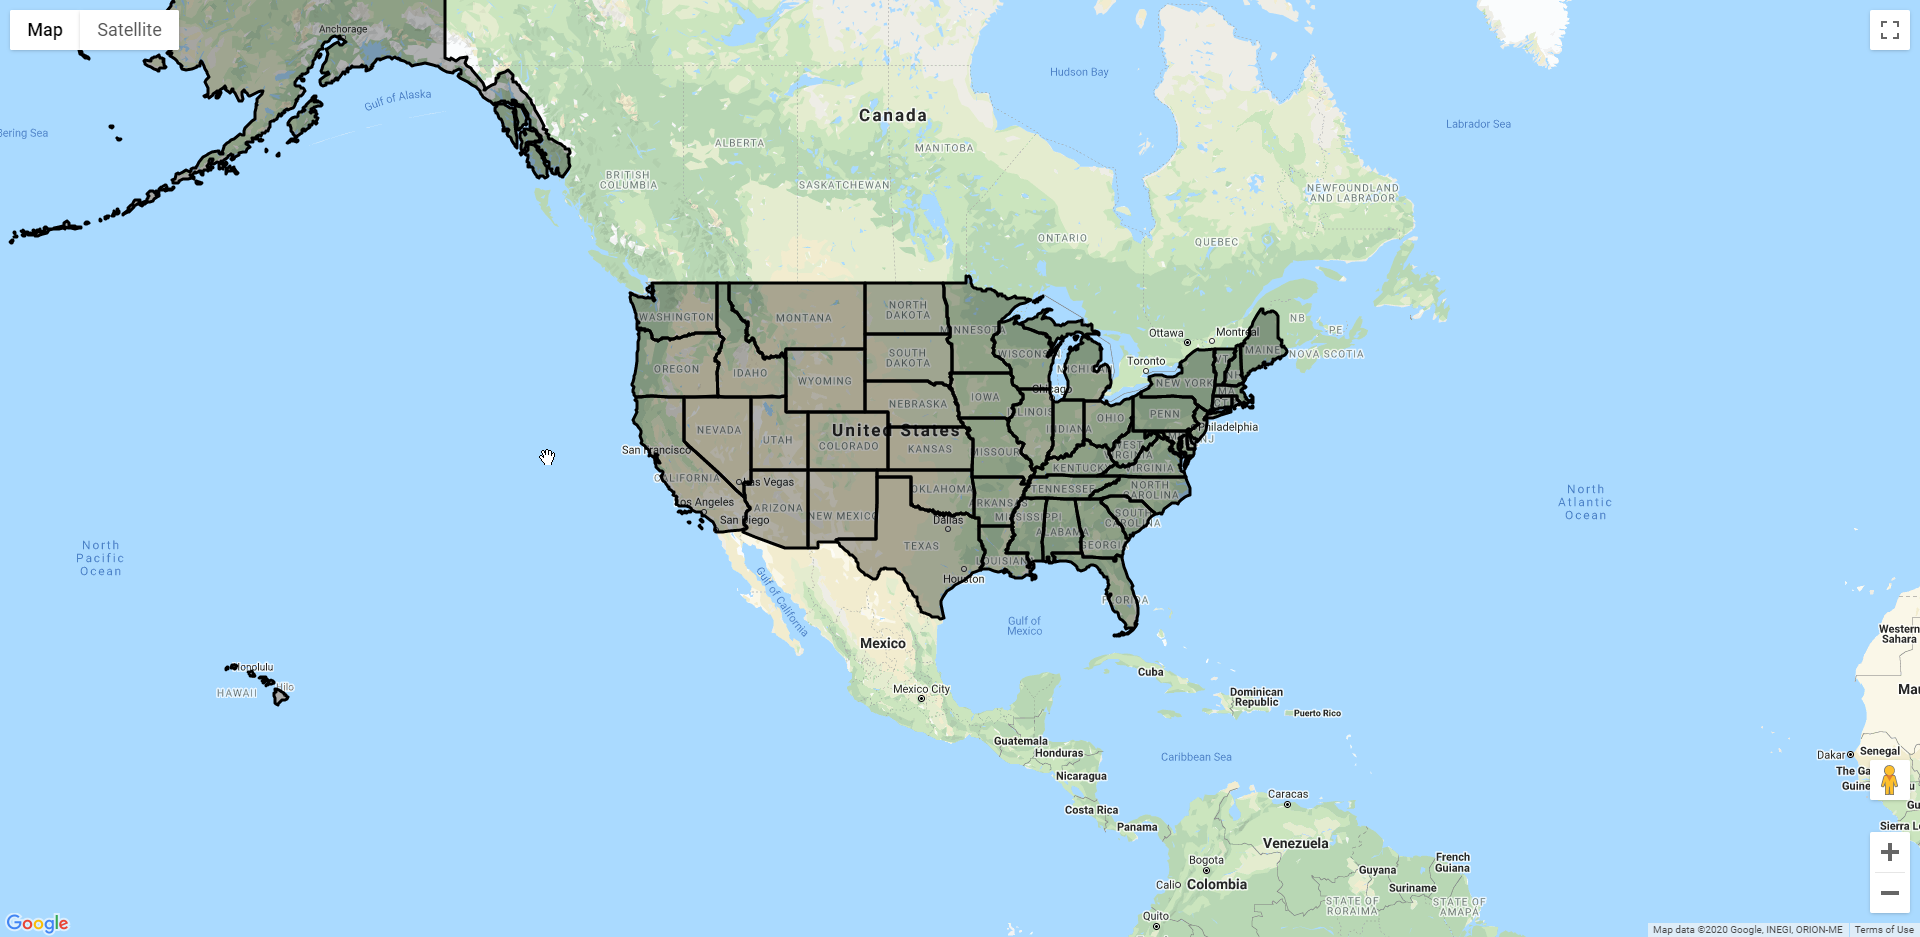
Test your website and you should see the shapes on the map:
You can customize the styling of the shapes like this:
    map.data.setStyle({
        fillColor: 'green',
        strokeWeight: 1
    });
which you would insert into the initMap() function:
    <script>
      var map;
      function initMap() {
        map = new google.maps.Map(document.getElementById('map'), {
          zoom: 4,
          center: {lat: 37.0902, lng: -95.7129}
        });

        // NOTE: This uses cross-domain XHR, and may not work on older browsers.
        map.data.loadGeoJson(
            'https://benelfner.com/states.json');

        map.data.setStyle({
          fillColor: 'green',
          strokeWeight: 1
        });
      }
    </script>
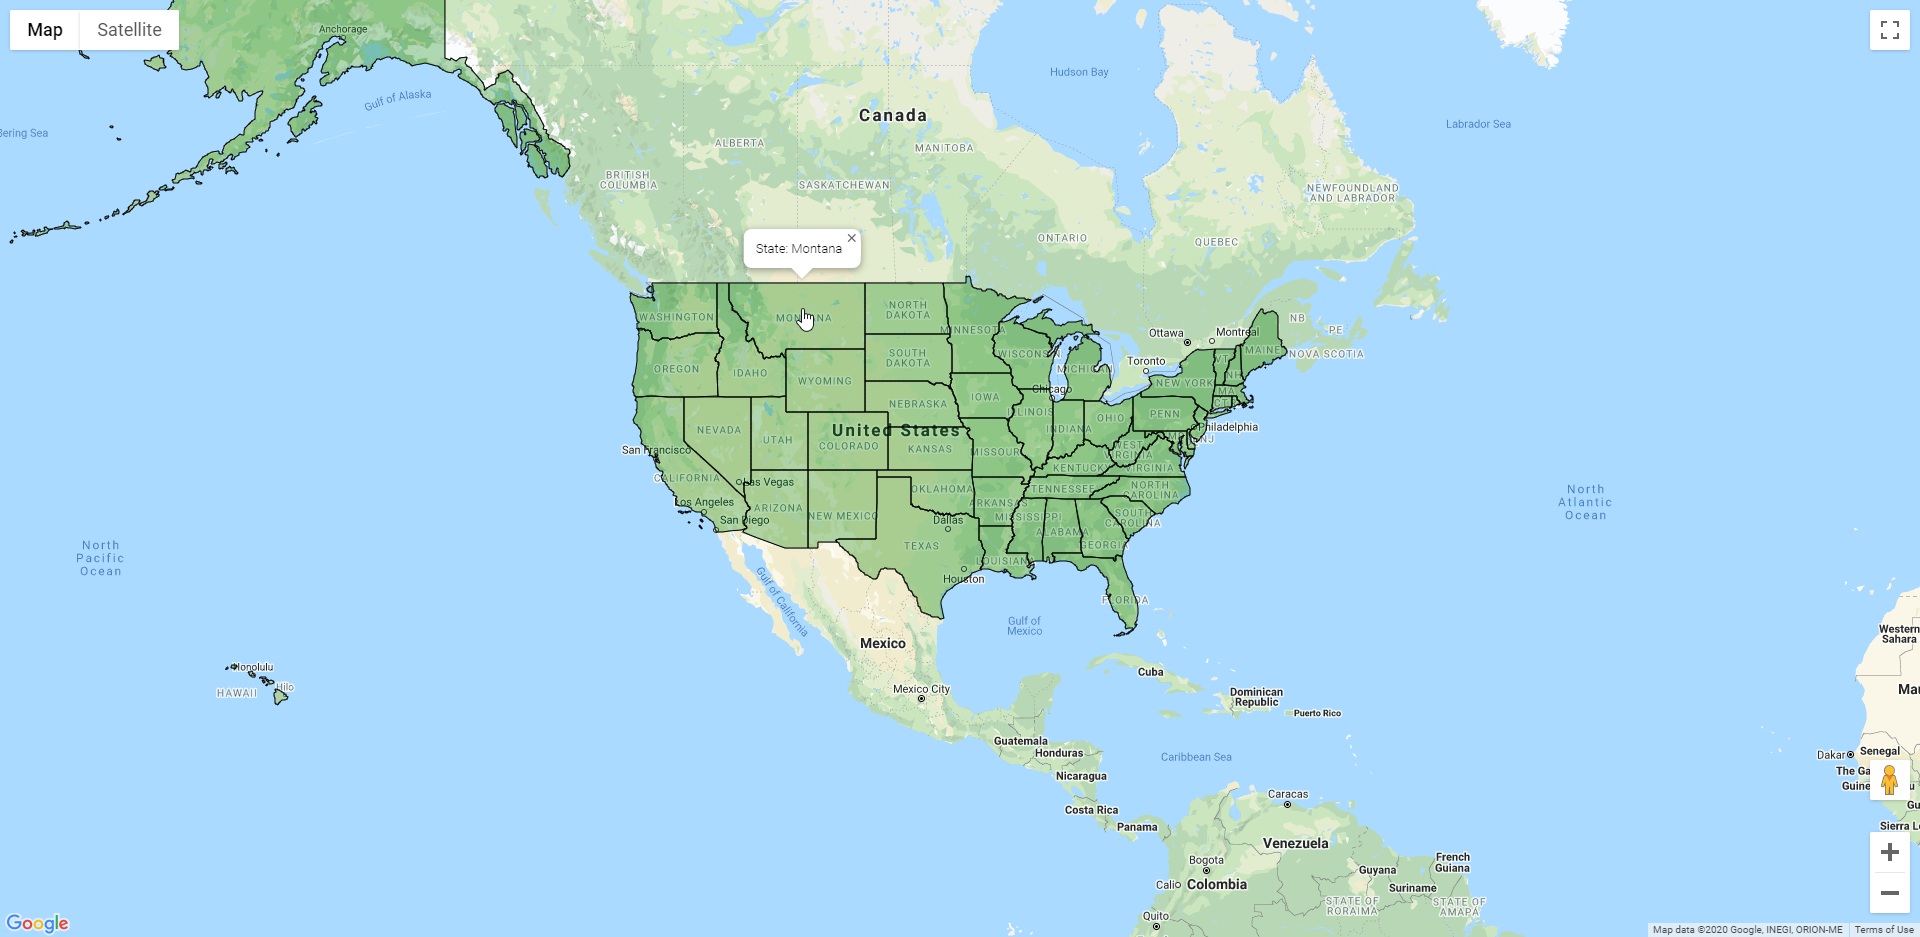
to make the map look like this:

Finally, to display information when clicking on a shape add this line to the initMap() function:
var infowindow = new google.maps.InfoWindow();
Now you need to create a custom feature where you can choose what will be displayed on a click. The basic outline will look like this.
    map.data.addListener('click', function(event) {
      ...
      infowindow.setContent(html); // show the html variable in the infowindow
      infowindow.setPosition(event.latLng); // anchor the infowindow at the marker
      infowindow.setOptions({pixelOffset: new google.maps.Size(0,-30)}); // moves the infowindow up slightly to the top of the marker icon
      infowindow.open(map);
    });
The text you want to display needs to be put in the html variable. To get information from the shape that was clicked on you need to specify the name of the attribute you want in this line of code
event.feature.getProperty("...");
An example:
    let state = event.feature.getProperty("NAME");
    let html = 'State: ' + state; // combine state name with a label
This code gets the NAME attribute from the shape that is clicked on and then sets the state variable to that name. Then the name is combined with the string 'State: ' and then it is saved into the html variable. An example of the text that could be stored is 'State: Montana'. When this code is combined with the code above it the script section should look like this.
    <script>

          var map;
          function initMap() {
            map = new google.maps.Map(document.getElementById('map'), {
              zoom: 4,
              center: {lat: 37.0902, lng: -95.7129}
            });

            // NOTE: This uses cross-domain XHR, and may not work on older browsers.
            map.data.loadGeoJson(
                'https://simplemaps.com/static/demos/resources/shapes-google-maps/shapes-google-maps/states.json');

            map.data.setStyle({
              fillColor: 'green',
              strokeWeight: 1
            });


            var infowindow = new google.maps.InfoWindow();

            map.data.addListener('click', function(event) {
              let state = event.feature.getProperty("NAME");
              let html = 'State: ' + state; // combine state name with a label
              infowindow.setContent(html); // show the html variable in the infowindow
              infowindow.setPosition(event.latLng); // anchor the infowindow at the marker
              infowindow.setOptions({pixelOffset: new google.maps.Size(0,-30)}); // move the infowindow up slightly to the top of the marker icon
              infowindow.open(map);
            });

          }
    </script>
That's it. You've added state shapes to your Google Map and made the states clickable!
Home | License | Privacy | Releases | Testimonials | Resources | Documentation | Order Lookup | All Maps | FAQs
Formerly FlashUSAmap.com and FlashWorldMap.com
SimpleMaps.com is a product of Pareto Software, LLC. © 2010-2024.