Chris Youderian - 9/6/2016
Interactive maps are a great way to visualize data and enhance the beauty and functionality of your website. Google Maps or Open Street Maps are popular options for street-level mapping. But, they are overkill if you just want a small-scale map that cleanly integrates with your site's design. A simpler and cleaner alternative is to use an SVG (Scalable Vector Graphic) map. Because SVG maps are vector images, they can be resized for zooming and web responsiveness without any loss of fidelity. And, browser support for SVG images is nearly ubiquitous.
Many free SVG maps already exist online. For example, the Wikimedia Commons and our own SVG map library are great resources. However, existing maps may be out of date, have errors, or simply not exist for your area of interest. For example, maybe you need an up-to-date state legislative map for Wyoming in SVG format. Good luck! Sometimes, you won't have any option but to create your own SVG map from scratch.
About a year ago, I wrote a tutorial for Smashing Magazine on how to create SVG maps using open source data and tools. However, that process required installing a python library, Kartograph.py, that required a lot of dependencies and was, frankly, difficult for even technical users to follow. Over the past year, Kartograph.py has been abandoned and a new tool, MapShaper, has added support for exporting SVG maps. MapShaper is a Shapefile editing tool created by Matthew Bloch. Unlike, Kartograph.py, MapShaper can be used via a modern web browser at http://www.mapshaper.org. This means you can easily create custom SVG maps without needing to install anything on your computer.
In this tutorial, I'll teach you how to create an SVG map of the United States using public census data. That's useful, but a little boring. So, for additional practice, we'll overlay all the US National Parks over the map. Last month was, after all, the 100th anniversary of the National Park Service! When we are finished our map will look like this:

Making a map requires us to:
Geographical data is often stored in the Shapefile format. Shapefile is an open standard geospatial vector data format created by Esri. Working with this type of data is often referred to as GIS (Geographical Information System) work. GIS software can be quite intimidating, but it doesn't need to be. There are, however, a couple things you should understand about Shapefiles and geographic data.
Free geographic data can be found from many sources online, here is a fun list to get you started. For, this tutorial we'll be getting our U.S. state data from the US Census Bureau. Download the map at a 20 million to 1 resolution.
The National Park data we'll use comes from Natural Earth. Natural Earth provides public domain map data that is created by volunteers. It's a great source for well-formatted data optimized for small-scale maps. Read more about the parks data and then download it.
You'll need to unzip both folders of data before moving forward.
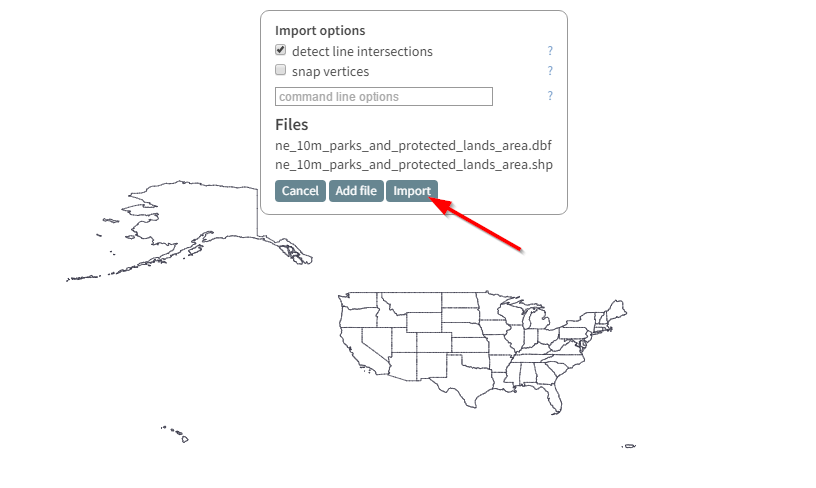
Now that we have our data, we need to import it into MapShaper. This will allow us to visually inspect the map data before making any changes. Fortunately, this a very simple process:
cb_2015_us_state_20m.shp and cb_2015_us_state_20m.dbf from your computer and drop them within the mapshaper.org browser window.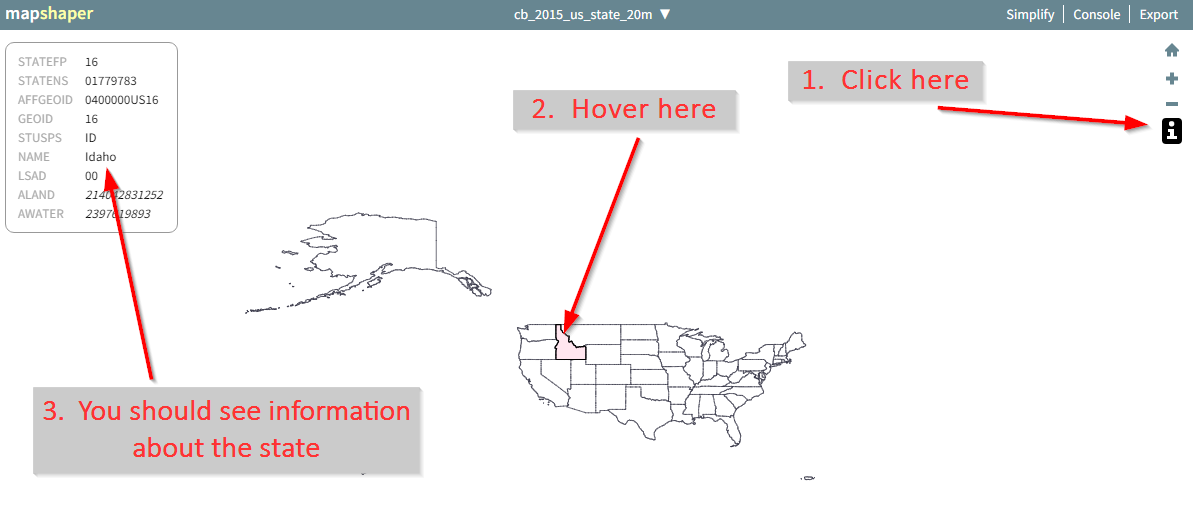
Repeat the above steps for the ne_10m_parks_and_protected_lands folder. Since you already have created a map, you'll need to click Import after Step 3.
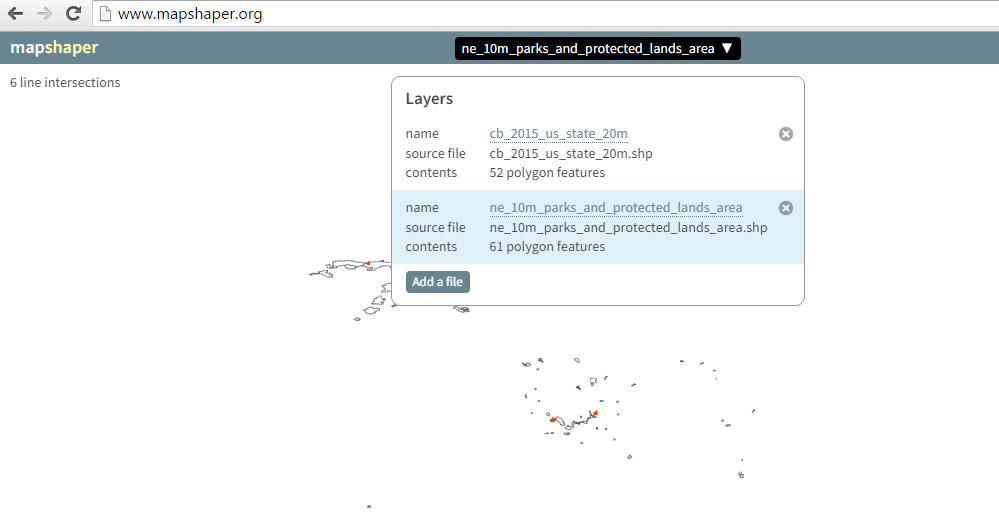
When you are done, the maps should exist within MapShaper as separate layers. You can switch between the two layers to view your two maps. Choose the cb_2015_us_state_20m.shp layer before moving forward.
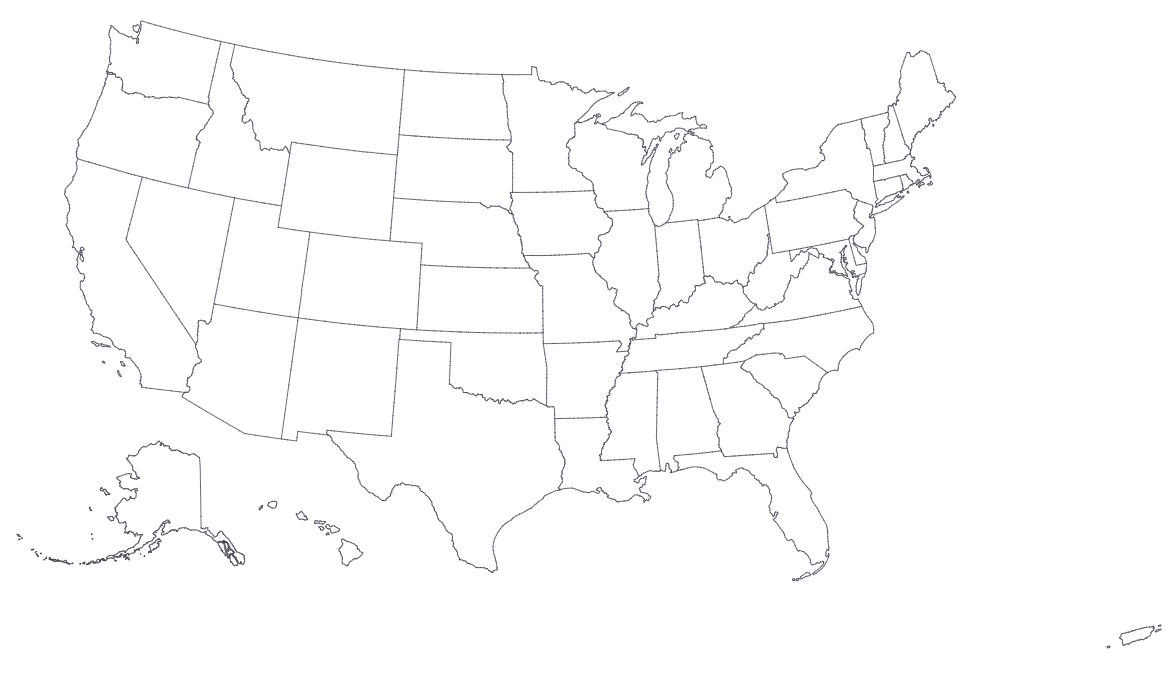
The first thing you may notice about our map is that the United States is pretty ugly. It looks all hunched over and Alaska is enormous. This is because we haven't yet chosen a projection for our map. One of the most popular projections for the U.S. is the Albers USA projection. This projection is not only more aesthetically pleasing, but conveniently shrinks Alaska and moves it and Hawaii to the bottom left of the map.
To change the map projection, click on Console and run the following command:
-proj albersusa
Your map should now look much nicer.
The Console only changes the current layer, so we need to choose the National Park layer and run the same command there. When you are done, go back to the States layer.
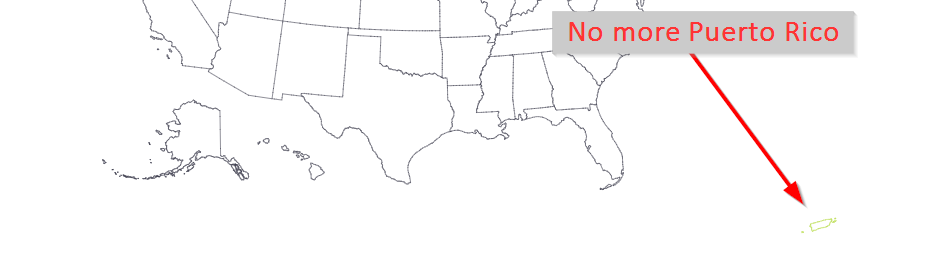
Our next edit to is remove Puerto Rico from the map. Don't get me wrong, I'm a big Puerto Rico fan—went there on my honeymoon and enjoyed visiting both the San Juan National Historic Site and the El Yunque National Forest. However, neither of these make it into our Natural Parks dataset and Puerto Rico makes our map awkwardly wide. So, we're going to ax it. Doing so is very easy with MapShaper. If we hover over Puerto Rico, we learn that it has a GEOID of 72. So, to remove it we just open up the Console and run the following command:
-filter 'GEOID != "72"';
-filter keeps every feature of the map that meets the stated condition. In this case, every feature that does not have a GEOID of 72. If you did it correctly, you should see Puerto Rico grayed out:
The final edit we'll make is to simplify the borders of our national parks. Simplification is the use of an algorithm to remove points from a polygon that are of only minimal visual importance. This allows us to reduce the size of a file with nearly an imperceptible reduction in quality.
Simplification is straightforward:
For this tutorial, we'll use the Visvalingam / weighted area method and simplify our National Parks layer to 60.2%. This screenshot of the Yellowstone and Grand Teton National Parks illustrates the minor visual changes caused by simplification.
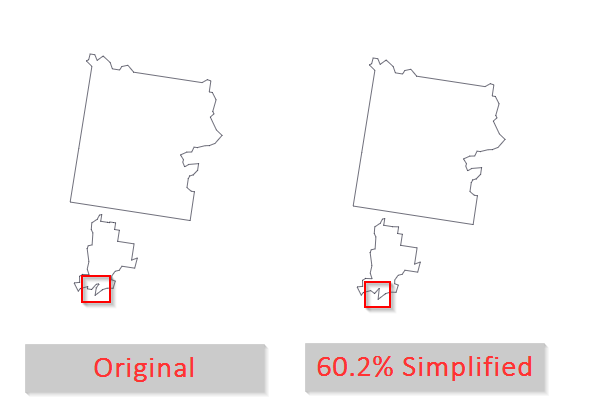
However, this small change will reduce our final SVG size from 379 KB to 298 KB. In this example, our input data is already at a fairly low resolution and doesn't need much additional simplification. But often times, simplifying your maps will be necessary to get your file size down to a web-appropriate level.
All that is left is to export our map as an SVG file. This is a straightforward process:
Unfortunately, this will create an SVG file with a bunch of unidentified features. What we would like to do is pass a unique id for each polygon to the SVG file so that the states and national parks can be easily identified and manipulated with scripts.
Doing this is very easy when we have a single layer. Just add the following to the command line options field in the Export menu:
id-field=unique_id
where unique_id is the name of the field that we want to uniquely identify each polygon. However, since we have two layers, we have two different field names that uniquely identify our polgyons. The variable unit_code identifies the National Parks and STUSPS identifies our states.
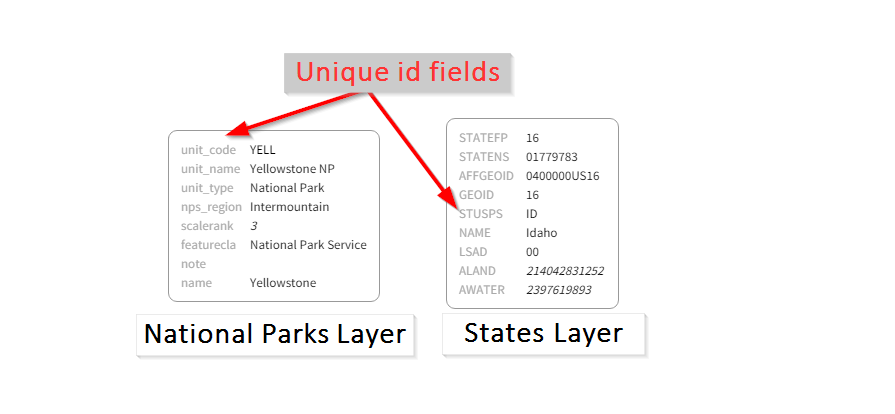
The solution is to rename unit_code and STUSPS to a common field name. We'll use the common field name unique_id for this example. This is accomplished as follows:
-rename-fields unique_id=unit_code-rename-fields unique_id=STUSPSNow that all of our layers contain a common field that uniquely identifies each polygon, we can export our map as an SVG file.

If you did everything correctly, when you open the SVG file in a text editor, you should find that each state and national park should be tied to a unique id.

This tutorial just scratches the surface of the different ways you can manipulate maps with MapShaper. Check out the MapShaper Wiki for the full list of commands possible.
If you open the SVG file in a web browser, you'll find that it is all black and it is hard to distinguish between states, let alone see the national parks.
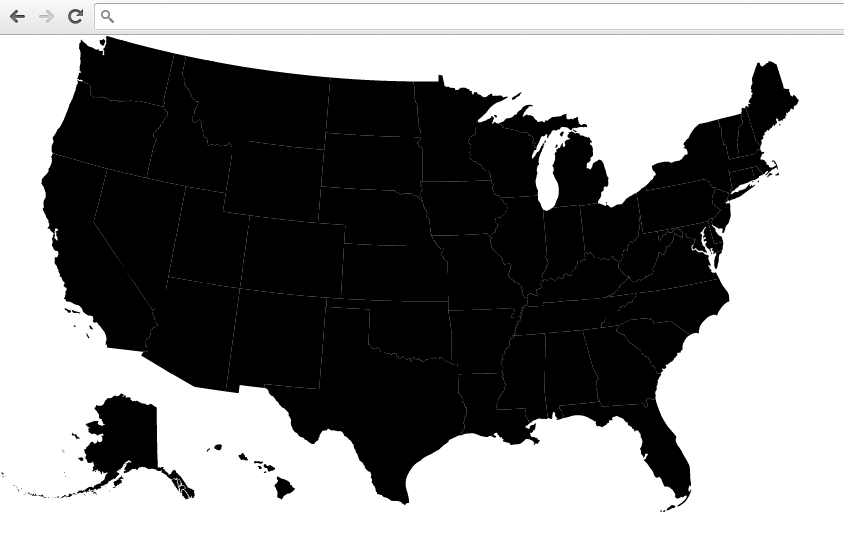
We can easily remedy this problem by changing the map styling in Inkscape. Inkscape is an open source vector graphics editor that you can download for free.
Our SVG file contains 2 groups: the states and the national parks. The states group is on top. We will edit this group as follows:
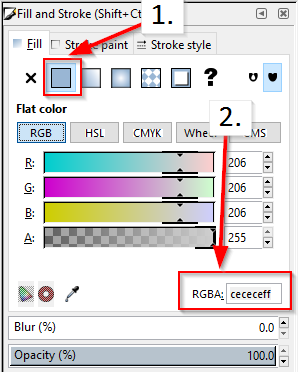
Our states group now looks great:
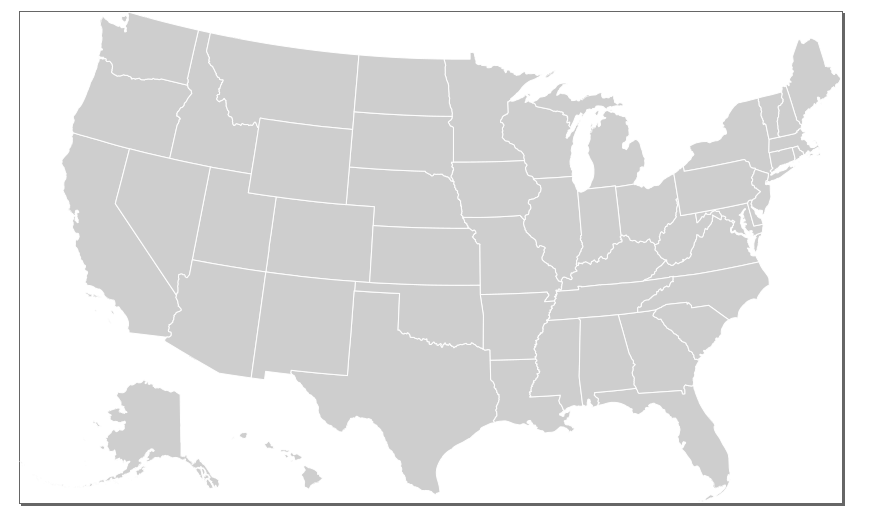
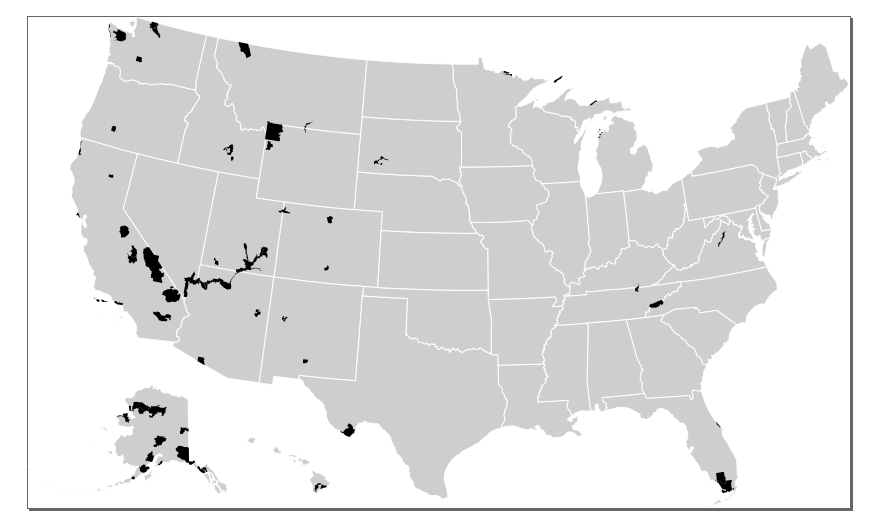
However, our states group is covering up our national parks. To fix this, we simply move the states group to the bottom of the document as follows:
You should now see the National Parks in black overlaying the states.
Finally, to give the map more of a Smokey-The-Bear feel, we can change the color of the national parks the same way we changed the color of the states.
That's it! We've created an SVG map from a couple of shapefiles. Feel free to download the end result. You could add labels to the map in Inkscape, embed your SVG map in a webpage, and make it interactive using JavaScript. Hope you learned something!
Home | License | Privacy | Releases | Testimonials | Resources | Documentation | Order Lookup | All Maps | FAQs
Formerly FlashUSAmap.com and FlashWorldMap.com
SimpleMaps.com is a product of Pareto Software, LLC. © 2010-2024.