![]()
Power Bi is software used to connect to and visualize any data. It can transform the data into coherent, visually immersive, and interactive reports that are fully compatible with our interactive maps. It's easy to add our maps to your Power Bi report using our File Hosting, please just follow these steps:
First, choose the map you want to install
Customize your map using our online customization tool.
Host your map files on SimpleMaps.com (detailed instructions). Note: You could also self-host the map files by uploading the mapdata.js and worldmap.js files to your server over FTP. However, it is simpler to use our hosting.
Copy the embedding code from the online customization tool. It should look something like this:
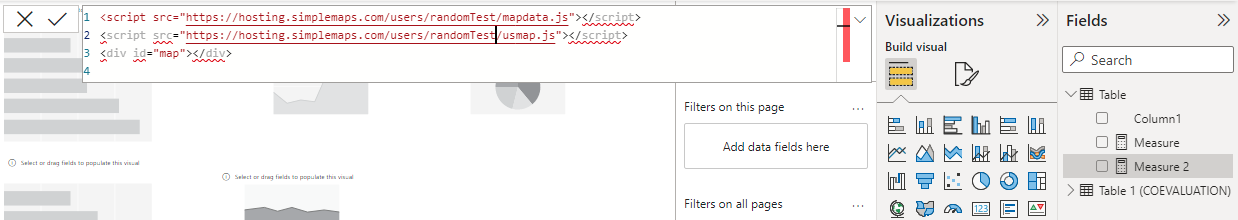
<script src="https://hosting.simplemaps.com/users/RANDOM_ID/mapdata.js"></script>
<script src="https://hosting.simplemaps.com/users/RANDOM_ID/worldmap.js"></script>
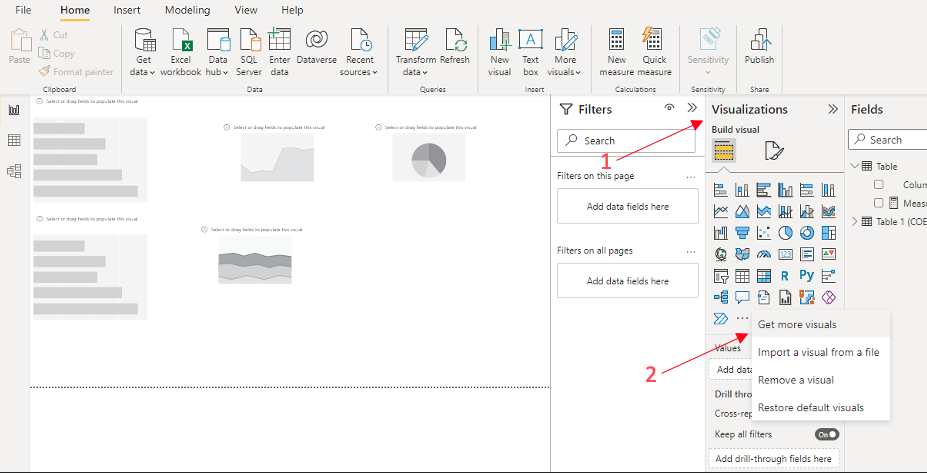
<div id="map"></div>Go over to the Power Bi report home page. We need to add the HTML content visual. Under the visualizations menu, click the three dots at the bottom (...) and select get more visuals.
Search for "HTML" and add "HTML content".
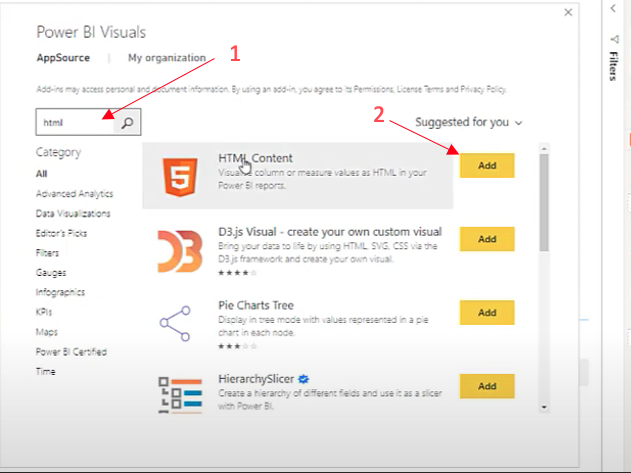
You should be able to see the HTML content addon at the bottom of the visualizations menu.
![]()
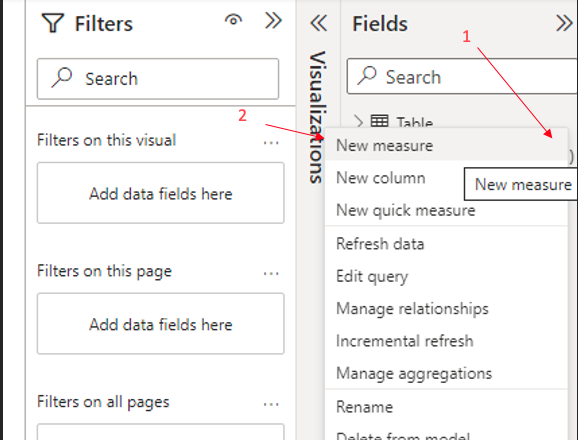
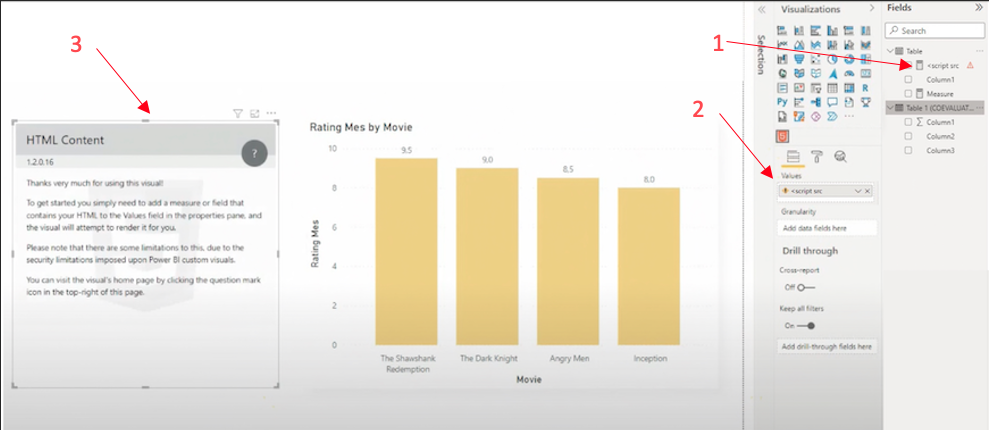
Create a new measure.
Paste the embedded code that you copied in Step 3 into the box.
Select the HTML content visual and drag it to your desired location on the report.
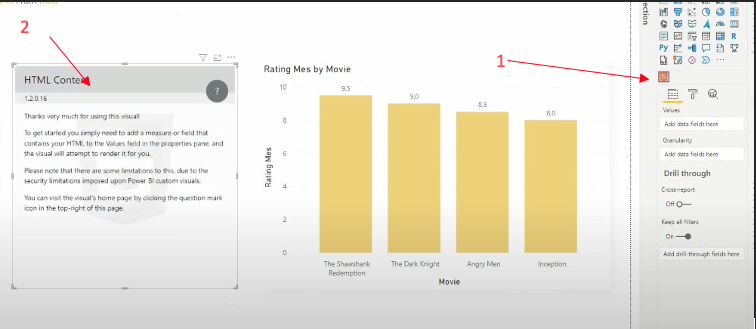
Select the measure that has the embedded code and drag it to the values section. You should be able to see your map on the HTML Content
Home | License | Privacy | Releases | Testimonials | Resources | Documentation | Order Lookup | All Maps | FAQs
Formerly FlashUSAmap.com and FlashWorldMap.com
SimpleMaps.com is a product of Pareto Software, LLC. © 2010-2024.